Comparison of Measurement Techniques for Photoreceptor Loss in Geographic Atrophy
 Maria Schulz, Sairi Zhang, Jeong W. Pak, Rick Voland, Mark Banghart, Barbara A. Blodi, Amitha Domalpally
Abstract
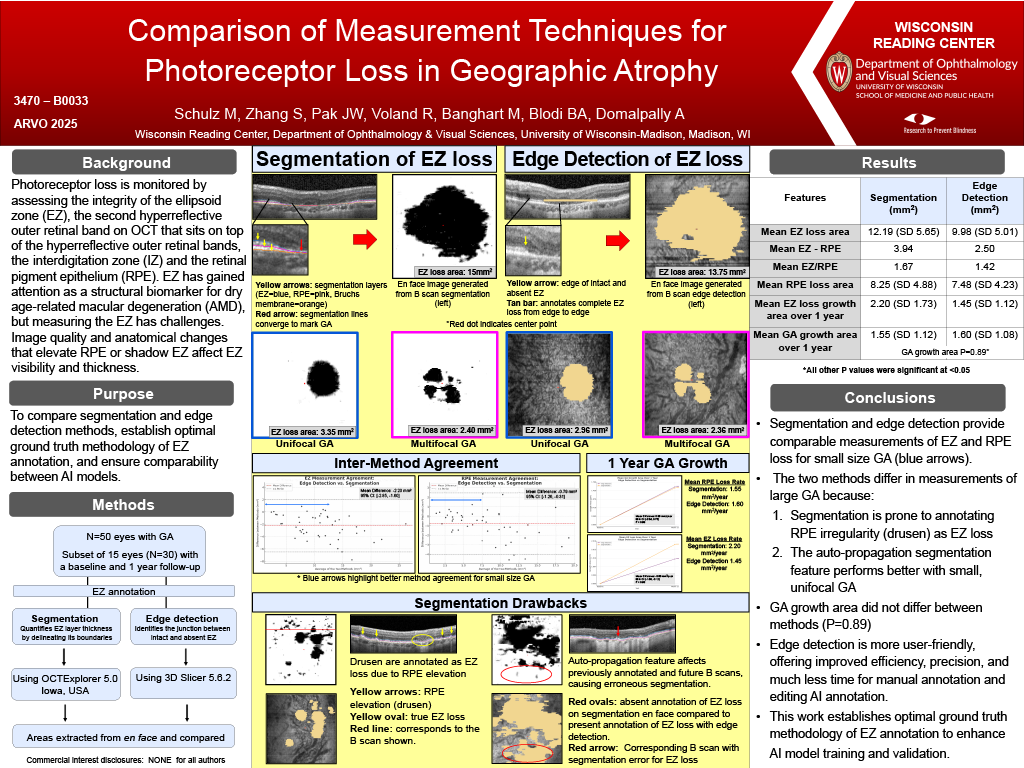
Purpose: This study compares two methods for assessing ellipsoid zone (EZ) loss on optical coherence tomography (OCT): traditional segmentation of EZ layers and edge detection of absent EZ. Automated assessments of EZ loss are used as endpoints in geographic atrophy (GA) clinical trials. While segmentation of retinal layers traditionally defines EZ loss, it includes drusen and other artifacts, potentially overestimating loss. Edge detection of EZ loss allows human experts to refine annotations by restricting to areas related to GA, offering a more accurate depiction of true GA-associated loss. Establishing reproducible ground truth methods is important for developing AI algorithms.
Methods: OCT images from 20 eyes with GA were included for the comparison of EZ loss area and RPE loss area between segmentation (OCT Explorer 5.0, Iowa, USA) and edge detection methods (3D Slicer 5.6.2, open source software). Areas of EZ loss and RPE loss were calculated from the en face maps of each method and compared using paired t-test. In addition, percentages of intact EZ within the central 1 mm and 3 mm circles of the ETDRS grid were calculated to assess photoreceptor preservation in the macula.
Results: The mean area (mm2) of EZ loss was 9.35 (SD 5.95) by edge detection and 10.11 (SD 6.07) by segmentation with a mean difference of -0.76 (95% CI -1.49, -0.03) (P=0.041). The mean area (mm2) of RPE loss was 6.28 (SD 4.34) by edge detection and 6.07 (SD 4.08) by segmentation with a mean difference of 0.21 (95% CI -0.28, 0.71) (P=0.38).
The mean ratio of EZ loss to RPE loss (EZ/RPE) was 1.60 for edge detection and 1.83 for segmentation with a mean difference in ratios of -0.23 (95% CI -0.44, -0.01) (paired Wilcoxon P=0.008).
The mean percentage of intact EZ within the central 1 mm circle was 31% (SD 35%) for edge detection and 29% (SD 38%) for segmentation (P=0.46). The mean percentage of intact EZ within the central 3 mm circle was 34% (SD 30%) and 30% (SD 31%), respectively (P=0.054).
Conclusion: The ratio of EZ/RPE endpoint is comparable between segmentation and edge detection methods. Future studies should evaluate the strength of correlation between GA area growth and the EZ/RPE ratio using both methods. This work establishes optimal ground truth methodology of EZ annotation to enhance AI model training and validation.