Multimodal Imaging Assessment of Risk Factors for GA Progression
 Thomas Saunders, Jeong W. Pak, Rick Voland, Karl G. Csaky, Barbara A. Blodi, Amitha Domalpally
Abstract
Purpose: Geographic atrophy (GA) is a multifactorial disease posing challenges in predicting progression. While prior studies have identified key risk factors on color photography and fundus autofluorescence (FAF), advancements in OCT have introduced novel biomarkers that warrant exploration. This study integrates established with novel biomarkers in a multimodal assessment of their relative contributions to GA progression.
Methods: Heidelberg Spectralis images of 43 eyes (43 participants) with two visits one year apart from a GA clinical trial (GSK 341) were analyzed. FAF evaluation included GA area, reticular pseudodrusen (RPD), foveal involvement, focality, junctional zone pattern, and non-GA areas within 1 and 3 mm circles (Macular Tissue Integrity Index (MTII)). OCT evaluation included ellipsoid zone (EZ) and retinal pigment epithelium (RPE) loss, EZ/RPE loss ratio, EZ loss minus RPE loss, and intact EZ within 1 and 3 mm circles (EZ Integrity Index (EZII)). Regression models evaluated associations between imaging biomarkers, demographics, and GA progression.
Results: Median age of participants was 76.5 years, 63% female, 63% former smoker, with mean BMI of 28.2. Mean (SD) baseline GA area was 8.87 mm2 (5.34) by FAF and 9.40 mm2 (4.93) by OCT, with mean rate of progression of 1.90 mm2 (1.39) by OCT. GA was subfoveal in 42% of eyes, multifocal in 74%, and bilateral in
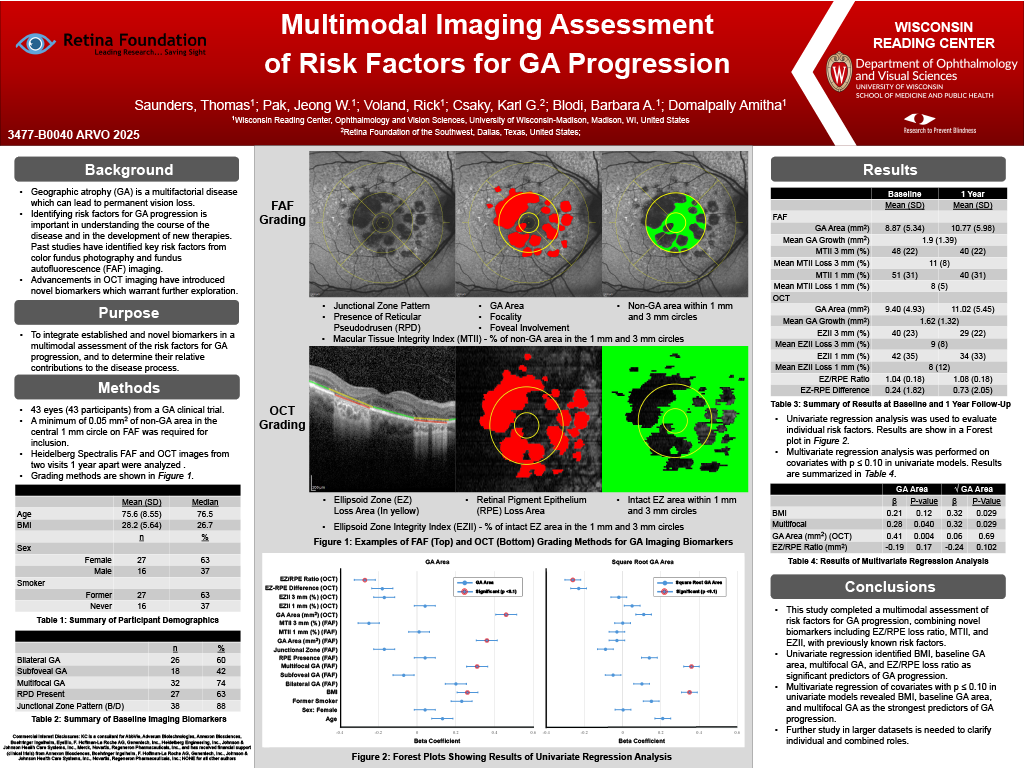
61% of subjects. RPD was present in 37%. Junctional zone pattern was banded/diffuse in 88% and focal/patchy in 12%. Mean MTII was 51% in the 1 mm and 48% in the 3 mm zones, while mean EZII was 42% and 38%, respectively. Mean EZ/RPE ratio was 1.90 mm2 (0.18). Mean difference between EZ and RPE loss was 0.24 mm2 (1.82). Univariate regression analyses identified BMI, baseline GA area, multifocal GA, and EZ/RPE ratio as significant predictors of GA progression. Multivariate regression, adjusted for covariates with p 5 0.10 in univariate models, revealed baseline GA area, multifocal GA and BMI as the strongest predictors. Univariate results are presented in Forest plots (Figure 1) and multivariate results in a table (Figure 2).
Conclusions: In a cohort of GA subjects, multifocal GA was the common significant predictor in both GA and square root GA progression models. The lack of significance in EZ/RPE ratio may be due to potential correlation with multifocality. Further exploration in larger datasets is needed to clarify their independent and combined roles.